The basic building blocks of a spreadsheet are rows, columns, and cells, where each cell is the intersection of a row and a column.
A spreadsheet is a digital tool that helps you organize, calculate, and analyze data using a grid made up of rows and columns.
This structure lets you easily enter and manage data in a clear, organized way.
When you work with a spreadsheet, you interact mainly with cells arranged in rows (horizontal lines) and columns (vertical lines).
Each cell is labeled by its column letter and row number, like A1 or B2, which helps you quickly find and reference data.
Understanding how these parts work together is key to using spreadsheets effectively, whether for simple lists or complex calculations.
Spreadsheets give you the power to perform automatic calculations, sort data, and create visual reports.
Knowing what rows, columns, and cells do will make your tasks easier, whether you’re keeping track of expenses, managing projects, or analyzing numbers.
Understanding Spreadsheets
Spreadsheets help you organize, calculate, and analyze data quickly. They use a grid made of rows and columns, where you can enter numbers, text, or formulas. You work within digital pages called worksheets, which are grouped inside files called workbooks.
Definition and Purpose
A spreadsheet is a digital tool made up of rows and columns. You use it to hold data, mainly numbers and short text, in an organized way. Its main purpose is to perform calculations and analyze information automatically.
You can enter data into individual cells, then apply formulas to calculate sums, averages, or other results without doing the math yourself. Spreadsheets are helpful for budgets, schedules, reports, and many other tasks.
You benefit from automation since spreadsheets update results instantly when data changes, saving you time and reducing errors.
Spreadsheet Structure and Layout
The spreadsheet page, called a worksheet, looks like a grid. Horizontal lines create rows, numbered 1, 2, 3, and so on. Vertical lines form columns, labeled with letters like A, B, C.
Each cell is identified by combining its column letter and row number (for example, B3). Cells are the basic units where you put data.
Multiple worksheets make up a workbook. You switch between sheets using tabs at the bottom of the window. This helps you organize different sets of data within one file, like having separate sheets for expenses, sales, and inventory.
You can also format cells by changing fonts, colors, or alignment to make your data easier to read.
Common Spreadsheet Software
Several spreadsheet programs allow you to create and edit spreadsheets on your computer or online.
Microsoft Excel is the most widely used software. It offers many tools, such as formulas, charts, and pivot tables, letting you analyze complex data with ease.
Google Sheets runs in your web browser. It supports real-time collaboration, so you and your team can edit the same workbook at once from anywhere.
Other options include LibreOffice Calc and Apple Numbers, but Excel and Google Sheets are the most common choices because of their features and ease of use.
Using these programs, you can manage your data effectively across devices and platforms.
The Grid: Rows and Columns
A spreadsheet is made up of a grid formed by rows and columns. These create cells, where you enter data. Understanding how rows and columns work helps you organize and find data quickly.
What Are Rows?
Rows run horizontally in your spreadsheet. Each row is numbered, starting from 1 at the top and increasing as you move down.
You can think of a row as a single record or entry in your table. For example, one row might hold all the details about a customer or a product.
Rows stretch across the entire width of the spreadsheet. When you select a row, you highlight every cell from the first to the last column in that row.
You can adjust row height to fit the data inside. Rows are usually identified by their number on the left side of the sheet.
What Are Columns?
Columns run vertically in your spreadsheet. Each is labeled with a letter, starting with A on the far left.
Columns often represent categories or characteristics of your data, like “Name” or “Price.” The column letter helps you find a specific cell or range easily.
Columns extend from the top of the worksheet to the bottom. Selecting a column highlights every cell in that column.
You can change the width of columns, which affects how much data you can see without wrapping or cutting off.
Rows and Columns Interaction
Rows and columns intersect to form cells, the basic units where you input data. Each cell has a unique address based on its column letter and row number, such as B5 or D12.
This grid structure allows you to reference, sort, and analyze your data precisely.
For example, you can sum values in a row or column using formulas like =SUM(2:2) for a row or =SUM(B:B) for a column.
This combination of rows and columns creates a clear and flexible way to organize your data.
Cells: The Building Blocks
Cells are the smallest parts of a spreadsheet where you enter and store data. Each one has a unique label based on its position in the grid. You use references to work with cells individually or in groups, and the data inside cells can be of different types depending on your needs.
Cell Definition and Addressing
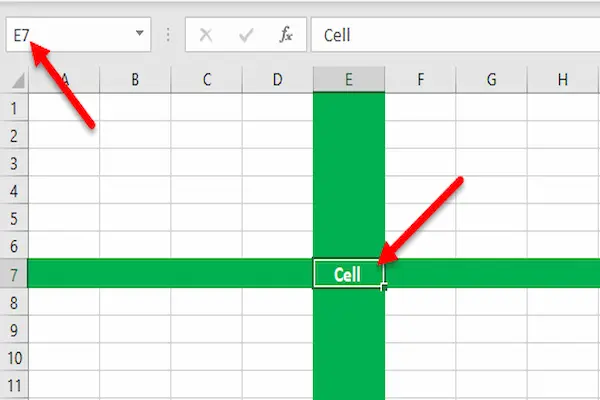
A cell is a single box in the spreadsheet formed where a row and a column intersect. Each cell has a unique address made by combining the column letter with the row number, such as A1 or C5. This address helps you locate the cell quickly.
The cell you are currently working on is called the active cell. Its address appears in the “Name Box,” usually found near the formula bar.
Understanding cell addressing lets you navigate spreadsheets faster. You can select cells by clicking or move among them using arrow keys on your keyboard.
Cell References and Ranges
When you create formulas, you use cell references to point to specific cells. For example, a formula might refer to cell B2 to use its value in calculations.
There are three main types of references:
- Relative: Changes when copied to another location (e.g., A1).
- Absolute: Does not change when copied (e.g., $A$1).
- Mixed: Only the row or column is fixed (e.g., A$1 or $A1).
You can also work with ranges, which are groups of continuous cells like A1. Selecting ranges allows you to apply formulas or actions to multiple cells at once.
Types of Data Cells Can Hold
Cells can hold different types of data, including:
- Numbers for calculations.
- Text or labels for descriptions.
- Dates and times for scheduling or timelines.
- Formulas which calculate based on other cells.
Each data type affects how Excel processes and displays the content. For example, dates are usually treated as numbers internally, which lets you perform calculations like finding the difference between two dates.
Knowing how to enter and identify these data types helps you organize and analyze your information effectively.
Entering, Editing, and Organizing Data
You work with rows, columns, and cells to input and manage information in a spreadsheet. Proper data entry and good organization help you keep lists, budgets, billing records, and grades accurate and easy to use. Sorting and filtering let you find and arrange data fast without changing your original work.
Data Entry Basics
When entering data, click a cell and type your information. You can input text, numbers, or dates. Use the ENTER key to move down a column or the TAB key to move right across a row. Avoid adding formatting like dollar signs or commas during entry; instead, apply those later using spreadsheet tools.
Editing data is simple. Double-click the cell or use the formula bar to make changes. Auto Fill helps speed up data entry for sequences like months, numbers, or days. Drag the fill handle at the bottom right of a cell to fill a series automatically.
Always label your columns clearly. Good headings reduce mistakes when entering lists or inventory data and keep your information easier to read. Proofread numbers carefully to avoid typos that can affect calculations.
Sorting and Filtering Data
Sorting arranges your data in order, like alphabetizing names or ordering sales numbers from low to high. To sort, select the column you want, then choose ascending or descending order. This helps organize budgets, billing lists, or evaluations.
Filtering hides data that doesn’t meet your criteria. For example, you can filter grades to show only students who scored above a certain number. Filters help you view specific parts of your data without deleting anything.
Both sorting and filtering can be applied multiple times to narrow down data. These tools make managing large lists or complex spreadsheets much easier. They work best when your columns have clear headings and consistent data types.
Formulas and Functions
In spreadsheets, you use formulas and functions to perform calculations and analyze data automatically. This helps you work faster by letting the spreadsheet do the math for you based on the values in your cells. You will often enter these formulas in the formula bar to build dynamic results that update as your data changes.
What Is a Formula?
A formula is an equation you create to calculate a value using numbers, cell references, and operators like +, -, *, and /. Every formula starts with an equals sign (=), telling the spreadsheet to compute what follows.
For example, =A1+B1 adds the values in cells A1 and B1. If you change either cell’s value, the formula automatically updates to reflect the new total.
You can enter formulas directly in cells or use the formula bar to edit them. Using cell references in formulas makes your calculations dynamic and easy to adjust without rewriting formulas every time data changes.
Using Functions in Spreadsheets
Functions are built-in formulas that perform specific tasks, often more complex than simple arithmetic. You supply inputs, called arguments, inside parentheses. For example, =SUM(A1:A10) adds all numbers in cells A1 through A10.
Common functions you’ll use include:
- SUM(): totals a range of numbers.
- AVERAGE(): calculates the mean.
- MAX() and MIN(): find the highest or lowest values in a range.
Functions simplify your work by handling multiple cells or tasks with a single command. They can be combined with formulas or nested inside each other to perform advanced calculations.
Applying Formulas to Cell Ranges
Instead of applying formulas to individual cells, you can use cell ranges to include multiple values at once. A cell range is defined by two cells separated by a colon, like A1:A10, which means all cells from A1 to A10.
Using ranges with functions lets you quickly analyze large amounts of data. For example, =AVERAGE(B1:B20) calculates the average of twenty cells.
You can also combine functions with ranges in more advanced ways, like =SUMIF(A1:A10, ">50"), which sums only cells in A1 to A10 with values greater than 50.
Mastering ranges and how they work with formulas and functions will make your spreadsheets more powerful and easier to manage.
Advanced Features and Best Practices
Using tools and shortcuts can make managing spreadsheets faster and more efficient. You can summarize large amounts of data and navigate sheets quickly without relying solely on the mouse.
Using Pivot Tables
Pivot tables help you organize and analyze data by summarizing it in flexible ways. You start by selecting your data range and then insert a pivot table through the menu. It allows you to group data by categories, calculate sums, averages, or counts, and rearrange data easily by dragging fields.
With a pivot table, you can quickly discover trends or compare different sets of data without manually sorting or filtering. This feature is useful when working with large data sets because it saves time and reduces errors. You should always ensure your source data is well-structured with clear headers before creating a pivot table.
Keyboard Shortcuts
Keyboard shortcuts help you move around, select, and edit your spreadsheet fast. For example:
- Ctrl + Down Arrow takes you to the last row with data in a column.
- Ctrl + Right Arrow jumps to the last filled cell in a row.
- Shift + Spacebar selects the entire row.
- Ctrl + Spacebar selects the entire column.
Using these shortcuts reduces the need to scroll or click repeatedly. You can also use shortcuts to insert or delete rows and columns quickly, speeding up your work and improving your workflow. Memorizing a few key shortcuts makes your tasks smoother and more precise.